Positive Displacement Pumps Market Size, Share, Growth, Industry Statistic Report, By Type (Rotary {Gear, Vane, Screw}, Reciprocating {Diaphragm Piston/Plunger}), By End User (Water Treatment, Oil & Gas, Chemicals, Pharmaceutical, Food & Beverage), COVID19 Impact Analysis, By Regional Analysis (North America - U.S, Canada, Other); By (Asia-Pacific - India, Japan, China, South Korea, Japan, Australia, and Other); By (Europe - U.K., Germany, Netherlands, Lithuania, Austria, Belgium, Poland, Sweden, Spain, France, Russia and Other); By (Middle East - Saudi Arabia, UAE and Africa - South Africa, Zimbabwe and Row); - Global Industry Insights, Trends and Forecast, 2020-2027
Report Format : PDF
Published Date : Mar-2021
Pages : 180
Report ID : VSR009904
Report Format: PDF
Published Date: Mar-2021 | 180 Pages | Report ID: VSR009904
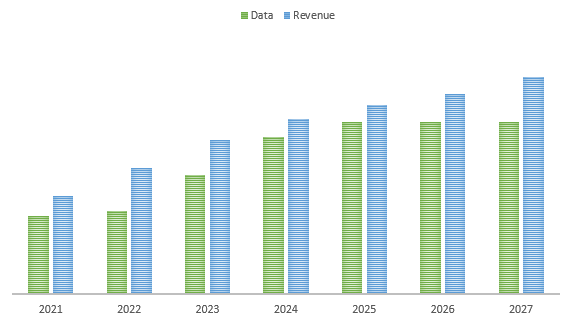
The Global Positive Displacement Pumps Market Size is estimated to reach around USD 20 billion in 2021 and is projected to grow at a CAGR of 5.21% during the forecast period. The product demand will grow at a significant rate due to the rising chemical, pulp & paper, and oil & gas industries in developing nations. Same time its showing growth opportunities in the water treatment sector are expected to propel the growth of the market.
The rapidly growing population and industries in developing regions, such as Asia and Africa, have created a thriving market environment. Water-dependent industries and already established plants are heavily dependent on water treatment facilities. Capacity expansion along with the installation of new facilities will augment product demand.
The expected rise in oil & gas exploration activities in North America and Europe will fuel the product demand. Market players will experience challenges such as the high maintenance cost of the product. Furthermore, significant competition from other pumps, such as centrifugal pumps, will also hamper the market growth. The ongoing COVID-19 pandemic has resulted in the loss of market revenue and market situations will be uncertain in the foreseeable future. Europe is a mature market with a concentrated presence of end-user industries. Rising oil & gas exploration activities along with the increasing number of water treatment facilities will drive product demand. Europe registered around 20% revenue share in 2020.
Request for a sample of this research report
The key players engaged in the positive displacement pumps market are The Weir Group PLC, Atlas Copco, GRUNDFOS, Flowserve Corporation, Sulzer, Xylem, SPX FLOW, Inc., Alfa Laval, etc.
Segments Covered in the Report
This report forecasts revenue growth and provides an analysis of the latest trends in each of the sub-segments from 2020 to 2027. For the purpose of this report, Veracious Statitistics Research has segmented the global positive displacement pumps market on the basis of product, application, and region:
PD Pumps Product Outlook (Revenue, USD Billion, 2020 - 2027)
Reciprocating
Rotary
Others
PD Pumps Application Outlook (Revenue, USD Billion, 2020 - 2027)
Oil and Gas
Water Treatment
Chemical
Pharmaceutical
Food and Beverages
Others
PD Pumps Regional Outlook (Revenue, USD Billion, 2020 - 2027)
North America
The U.S.
Canada
Europe
Germany
France
Asia Pacific
China
Japan
India
CSA
Brazil
The Middle East & Africa
Saudi Arabia
1 Report Overview
1.1 Study Scope
1.2 Key Market Segments
1.3 Players Covered: Ranking by Positive Displacement (PD) Pumps Revenue
1.4 Market Analysis by Type
1.4.1 Global Positive Displacement (PD) Pumps Market Size Growth Rate by Type: 2021 VS 2027
1.4.2 Reciprocating
1.4.3 Rotary
1.4.4 Others
1.5 Market by Application
1.5.1 Global Positive Displacement (PD) Pumps Market Share by Application: 2022-2027
1.5.2 Oil and Gas
1.5.3 Water Treatment
1.5.4 Chemical
1.5.5 Pharmaceutical
1.5.6 Food and Beverages
1.5.7 Others
1.6 Study Objectives
1.7 Years Considered
1.8 Overview of Global Positive Displacement (PD) Pumps Market
1.8.1 Global Positive Displacement (PD) Pumps Market Status and Outlook (2016-2027)
1.8.2 North America
1.8.3 East Asia
1.8.4 Europe
1.8.5 South Asia
1.8.6 Southeast Asia
1.8.7 Middle East
1.8.8 Africa
1.8.9 Oceania
1.8.10 South America
1.8.11 Rest of the World
2 Market Competition by Manufacturers
2.1 Global Positive Displacement (PD) Pumps Production Capacity Market Share by Manufacturers (2016-2021)
2.2 Global Positive Displacement (PD) Pumps Revenue Market Share by Manufacturers (2016-2021)
2.3 Global Positive Displacement (PD) Pumps Average Price by Manufacturers (2016-2021)
2.4 Manufacturers Positive Displacement (PD) Pumps Production Sites, Area Served, Product Type
3 Sales by Region
3.1 Global Positive Displacement (PD) Pumps Sales Volume Market Share by Region (2016-2021)
3.2 Global Positive Displacement (PD) Pumps Sales Revenue Market Share by Region (2016-2021)
3.3 North America Positive Displacement (PD) Pumps Sales Volume
3.3.1 North America Positive Displacement (PD) Pumps Sales Volume Growth Rate (2016-2021)
3.3.2 North America Positive Displacement (PD) Pumps Sales Volume Capacity, Revenue, Price and Gross Margin (2016-2021)
3.4 East Asia Positive Displacement (PD) Pumps Sales Volume
3.4.1 East Asia Positive Displacement (PD) Pumps Sales Volume Growth Rate (2016-2021)
3.4.2 East Asia Positive Displacement (PD) Pumps Sales Volume Capacity, Revenue, Price and Gross Margin (2016-2021)
3.5 Europe Positive Displacement (PD) Pumps Sales Volume (2016-2021)
3.5.1 Europe Positive Displacement (PD) Pumps Sales Volume Growth Rate (2016-2021)
3.5.2 Europe Positive Displacement (PD) Pumps Sales Volume Capacity, Revenue, Price and Gross Margin (2016-2021)
3.6 South Asia Positive Displacement (PD) Pumps Sales Volume (2016-2021)
3.6.1 South Asia Positive Displacement (PD) Pumps Sales Volume Growth Rate (2016-2021)
3.6.2 South Asia Positive Displacement (PD) Pumps Sales Volume Capacity, Revenue, Price and Gross Margin (2016-2021)
3.7 Southeast Asia Positive Displacement (PD) Pumps Sales Volume (2016-2021)
3.7.1 Southeast Asia Positive Displacement (PD) Pumps Sales Volume Growth Rate (2016-2021)
3.7.2 Southeast Asia Positive Displacement (PD) Pumps Sales Volume Capacity, Revenue, Price and Gross Margin (2016-2021)
3.8 Middle East Positive Displacement (PD) Pumps Sales Volume (2016-2021)
3.8.1 Middle East Positive Displacement (PD) Pumps Sales Volume Growth Rate (2016-2021)
3.8.2 Middle East Positive Displacement (PD) Pumps Sales Volume Capacity, Revenue, Price and Gross Margin (2016-2021)
3.9 Africa Positive Displacement (PD) Pumps Sales Volume (2016-2021)
3.9.1 Africa Positive Displacement (PD) Pumps Sales Volume Growth Rate (2016-2021)
3.9.2 Africa Positive Displacement (PD) Pumps Sales Volume Capacity, Revenue, Price and Gross Margin (2016-2021)
3.10 Oceania Positive Displacement (PD) Pumps Sales Volume (2016-2021)
3.10.1 Oceania Positive Displacement (PD) Pumps Sales Volume Growth Rate (2016-2021)
3.10.2 Oceania Positive Displacement (PD) Pumps Sales Volume Capacity, Revenue, Price and Gross Margin (2016-2021)
3.11 South America Positive Displacement (PD) Pumps Sales Volume (2016-2021)
3.11.1 South America Positive Displacement (PD) Pumps Sales Volume Growth Rate (2016-2021)
3.11.2 South America Positive Displacement (PD) Pumps Sales Volume Capacity, Revenue, Price and Gross Margin (2016-2021)
3.12 Rest of the World Positive Displacement (PD) Pumps Sales Volume (2016-2021)
3.12.1 Rest of the World Positive Displacement (PD) Pumps Sales Volume Growth Rate (2016-2021)
3.12.2 Rest of the World Positive Displacement (PD) Pumps Sales Volume Capacity, Revenue, Price and Gross Margin (2016-2021)
4 North America
4.1 North America Positive Displacement (PD) Pumps Consumption by Countries
4.2 United States
4.3 Canada
4.4 Mexico
5 East Asia
5.1 East Asia Positive Displacement (PD) Pumps Consumption by Countries
5.2 China
5.3 Japan
5.4 South Korea
6 Europe
6.1 Europe Positive Displacement (PD) Pumps Consumption by Countries
6.2 Germany
6.3 United Kingdom
6.4 France
6.5 Italy
6.6 Russia
6.7 Spain
6.8 Netherlands
6.9 Switzerland
6.10 Poland
7 South Asia
7.1 South Asia Positive Displacement (PD) Pumps Consumption by Countries
7.2 India
7.3 Pakistan
7.4 Bangladesh
8 Southeast Asia
8.1 Southeast Asia Positive Displacement (PD) Pumps Consumption by Countries
8.2 Indonesia
8.3 Thailand
8.4 Singapore
8.5 Malaysia
8.6 Philippines
8.7 Vietnam
8.8 Myanmar
9 Middle East
9.1 Middle East Positive Displacement (PD) Pumps Consumption by Countries
9.2 Turkey
9.3 Saudi Arabia
9.4 Iran
9.5 United Arab Emirates
9.6 Israel
9.7 Iraq
9.8 Qatar
9.9 Kuwait
9.10 Oman
10 Africa
10.1 Africa Positive Displacement (PD) Pumps Consumption by Countries
10.2 Nigeria
10.3 South Africa
10.4 Egypt
10.5 Algeria
10.6 Morocco
11 Oceania
11.1 Oceania Positive Displacement (PD) Pumps Consumption by Countries
11.2 Australia
11.3 New Zealand
12 South America
12.1 South America Positive Displacement (PD) Pumps Consumption by Countries
12.2 Brazil
12.3 Argentina
12.4 Columbia
12.5 Chile
12.6 Venezuela
12.7 Peru
12.8 Puerto Rico
12.9 Ecuador
13 Rest of the World
13.1 Rest of the World Positive Displacement (PD) Pumps Consumption by Countries
13.2 Kazakhstan
14 Sales Volume, Sales Revenue, Sales Price Trend by Type
14.1 Global Positive Displacement (PD) Pumps Sales Volume Market Share by Type (2016-2021)
14.2 Global Positive Displacement (PD) Pumps Sales Revenue Market Share by Type (2016-2021)
14.3 Global Positive Displacement (PD) Pumps Sales Price by Type (2016-2021)
15 Consumption Analysis by Application
15.1 Global Positive Displacement (PD) Pumps Consumption Volume by Application (2016-2021)
15.2 Global Positive Displacement (PD) Pumps Consumption Value by Application (2016-2021)
16 Company Profiles and Key Figures in Positive Displacement (PD) Pumps Business
16.1 Flowserve
16.1.1 Flowserve Company Profile
16.1.2 Flowserve Positive Displacement (PD) Pumps Product Specification
16.1.3 Flowserve Positive Displacement (PD) Pumps Production Capacity, Revenue, Price and Gross Margin (2016-2021)
16.2 Grundfos
16.2.1 Grundfos Company Profile
16.2.2 Grundfos Positive Displacement (PD) Pumps Product Specification
16.2.3 Grundfos Positive Displacement (PD) Pumps Production Capacity, Revenue, Price and Gross Margin (2016-2021)
16.3 ITT
16.3.1 ITT Company Profile
16.3.2 ITT Positive Displacement (PD) Pumps Product Specification
16.3.3 ITT Positive Displacement (PD) Pumps Production Capacity, Revenue, Price and Gross Margin (2016-2021)
16.4 KSB
16.4.1 KSB Company Profile
16.4.2 KSB Positive Displacement (PD) Pumps Product Specification
16.4.3 KSB Positive Displacement (PD) Pumps Production Capacity, Revenue, Price and Gross Margin (2016-2021)
16.5 Sulzer
16.5.1 Sulzer Company Profile
16.5.2 Sulzer Positive Displacement (PD) Pumps Product Specification
16.5.3 Sulzer Positive Displacement (PD) Pumps Production Capacity, Revenue, Price and Gross Margin (2016-2021)
16.6 Alfa Laval
16.6.1 Alfa Laval Company Profile
16.6.2 Alfa Laval Positive Displacement (PD) Pumps Product Specification
16.6.3 Alfa Laval Positive Displacement (PD) Pumps Production Capacity, Revenue, Price and Gross Margin (2016-2021)
16.7 Delta Group
16.7.1 Delta Group Company Profile
16.7.2 Delta Group Positive Displacement (PD) Pumps Product Specification
16.7.3 Delta Group Positive Displacement (PD) Pumps Production Capacity, Revenue, Price and Gross Margin (2016-2021)
16.8 Hermetic
16.8.1 Hermetic Company Profile
16.8.2 Hermetic Positive Displacement (PD) Pumps Product Specification
16.8.3 Hermetic Positive Displacement (PD) Pumps Production Capacity, Revenue, Price and Gross Margin (2016-2021)
17 Positive Displacement (PD) Pumps Manufacturing Cost Analysis
17.1 Positive Displacement (PD) Pumps Key Raw Materials Analysis
17.1.1 Key Raw Materials
17.2 Proportion of Manufacturing Cost Structure
17.3 Manufacturing Process Analysis of Positive Displacement (PD) Pumps
17.4 Positive Displacement (PD) Pumps Industrial Chain Analysis
18 Marketing Channel, Distributors and Customers
18.1 Marketing Channel
18.2 Positive Displacement (PD) Pumps Distributors List
18.3 Positive Displacement (PD) Pumps Customers
19 Market Dynamics
19.1 Market Trends
19.2 Opportunities and Drivers
19.3 Challenges
19.4 Porter's Five Forces Analysis
20 Production and Supply Forecast
20.1 Global Forecasted Production of Positive Displacement (PD) Pumps (2022-2027)
20.2 Global Forecasted Revenue of Positive Displacement (PD) Pumps (2022-2027)
20.3 Global Forecasted Price of Positive Displacement (PD) Pumps (2016-2027)
20.4 Global Forecasted Production of Positive Displacement (PD) Pumps by Region (2022-2027)
20.4.1 North America Positive Displacement (PD) Pumps Production, Revenue Forecast (2022-2027)
20.4.2 East Asia Positive Displacement (PD) Pumps Production, Revenue Forecast (2022-2027)
20.4.3 Europe Positive Displacement (PD) Pumps Production, Revenue Forecast (2022-2027)
20.4.4 South Asia Positive Displacement (PD) Pumps Production, Revenue Forecast (2022-2027)
20.4.5 Southeast Asia Positive Displacement (PD) Pumps Production, Revenue Forecast (2022-2027)
20.4.6 Middle East Positive Displacement (PD) Pumps Production, Revenue Forecast (2022-2027)
20.4.7 Africa Positive Displacement (PD) Pumps Production, Revenue Forecast (2022-2027)
20.4.8 Oceania Positive Displacement (PD) Pumps Production, Revenue Forecast (2022-2027)
20.4.9 South America Positive Displacement (PD) Pumps Production, Revenue Forecast (2022-2027)
20.4.10 Rest of the World Positive Displacement (PD) Pumps Production, Revenue Forecast (2022-2027)
20.5 Forecast by Type and by Application (2022-2027)
20.5.1 Global Sales Volume, Sales Revenue and Sales Price Forecast by Type (2022-2027)
20.5.2 Global Forecasted Consumption of Positive Displacement (PD) Pumps by Application (2022-2027)
21 Consumption and Demand Forecast
21.1 North America Forecasted Consumption of Positive Displacement (PD) Pumps by Country
21.2 East Asia Market Forecasted Consumption of Positive Displacement (PD) Pumps by Country
21.3 Europe Market Forecasted Consumption of Positive Displacement (PD) Pumps by Countriy
21.4 South Asia Forecasted Consumption of Positive Displacement (PD) Pumps by Country
21.5 Southeast Asia Forecasted Consumption of Positive Displacement (PD) Pumps by Country
21.6 Middle East Forecasted Consumption of Positive Displacement (PD) Pumps by Country
21.7 Africa Forecasted Consumption of Positive Displacement (PD) Pumps by Country
21.8 Oceania Forecasted Consumption of Positive Displacement (PD) Pumps by Country
21.9 South America Forecasted Consumption of Positive Displacement (PD) Pumps by Country
21.10 Rest of the world Forecasted Consumption of Positive Displacement (PD) Pumps by Country
22 Research Findings and Conclusion
23 Methodology and Data Source
23.1 Methodology/Research Approach
23.1.1 Research Programs/Design
23.1.2 Market Size Estimation
23.1.3 Market Breakdown and Data Triangulation
23.2 Data Source
23.2.1 Secondary Sources
23.2.2 Primary Sources
23.3 Disclaimer
Enquiry for Methodology
Positive Displacement Pumps Market Size, Share, Growth, Industry Statistic Report, By Type (Rotary {Gear, Vane, Screw}, Reciprocating {Diaphragm Piston/Plunger}), By End User (Water Treatment, Oil & Gas, Chemicals, Pharmaceutical, Food & Beverage), COVID19 Impact Analysis, By Regional Analysis (North America - U.S, Canada, Other); By (Asia-Pacific - India, Japan, China, South Korea, Japan, Australia, and Other); By (Europe - U.K., Germany, Netherlands, Lithuania, Austria, Belgium, Poland, Sweden, Spain, France, Russia and Other); By (Middle East - Saudi Arabia, UAE and Africa - South Africa, Zimbabwe and Row); - Global Industry Insights, Trends and Forecast, 2020-2027

Why Choose Veracious Statistics Research ?
Save Your Time
Cost-Effective Services
Wide Range of Reports
World Class Market Research
100% Customer Satisfaction
24/7 Customer care Support
Any more questions?
Get in touch with us quickly and easily. We are happy to help!
Do you still have questions?
Feel free to contact us anytime using our contact form.
Contact us

 2024 © Veracious Statistics Research All Rights Reserve